
FIG. 8.
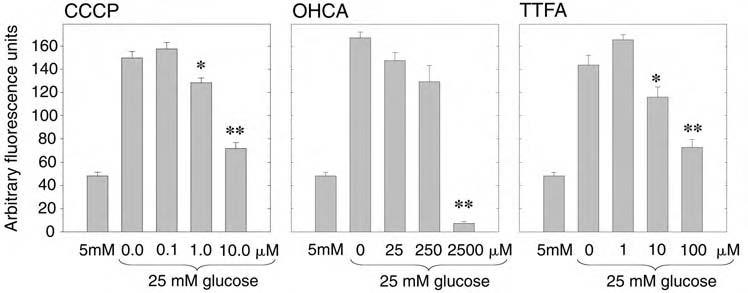
Effect of inhibitors of mitochondrial metabolism on H2O2 production in 3T3-L1 adipocytes under high glucose conditions. Fully differentiated 3T3-L1 adipocytes were maintained in either 5 mM glucose with 20 mM mannitol or 25 mM glucose as shown, prior to treatment with the indicated mitochondrial inhibitor (CCCP, OHCA, TTFA) for 1 h prioto measurement of H2O2 production by DCF-DA loading and confocal fluorescence microscopy. The data from a dose-response with each of the tested inhibitors is shown. * < 0.05 and **p < 0.001 (CCCP); **p < 0.001 (OHCA); * = 0.002 and **p < 0.001 (TTFA), compared with the control samples in 25 mM glucose without inhibitor.