
FIG. 9.
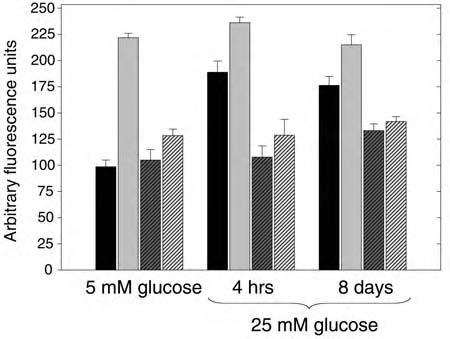
Effect of DPI on high glucose and insulin-stimulated H2O2 production. 3T3-L1 adipocytes were cultured in 5 mM glucose or mM glucose for 4 h or 8 days as indicated. Prior to measurement of cellular H2O2 production by loading with DCF-DA and confocal fluorescence microscopy, control cells (black bars) were also treated with 100 nM insulin for 5 min (gray bars) and also with 10 μM DPI without (dark gray hatched bars) or with insulin stimulation (light gray hatched bars).