Figure 1.

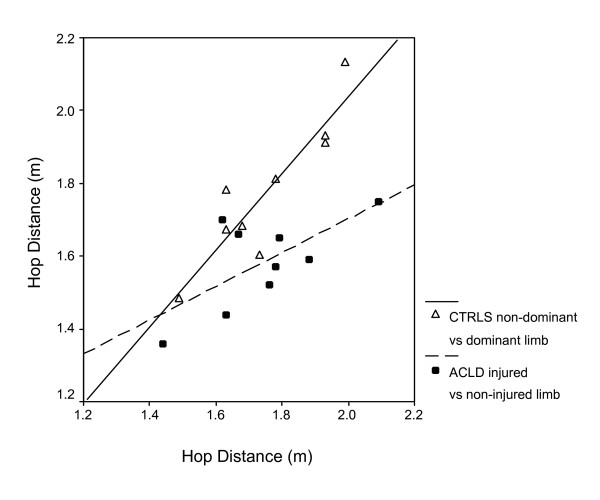
Pearson Product Moment Correlation plots illustrating the association in hop distance performance between limbs within the ACLD (r = 0.68; p = 0.04) and Control groups (r = 0.91; p = < 0.001).

Pearson Product Moment Correlation plots illustrating the association in hop distance performance between limbs within the ACLD (r = 0.68; p = 0.04) and Control groups (r = 0.91; p = < 0.001).