Figure 2.

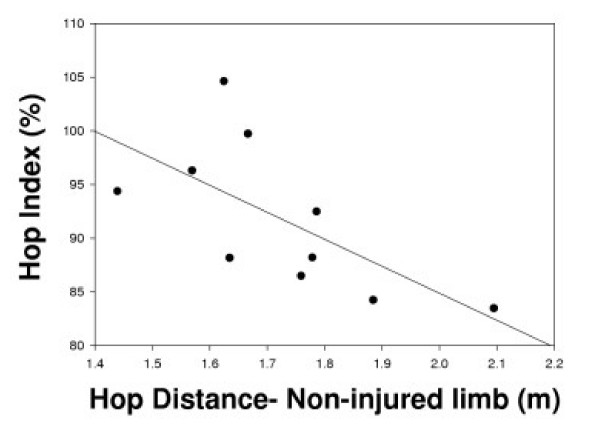
A Pearson Product Moment Correlation plot illustrating the association between the hop index (injured/non-injured limb hop distance × 100%) and the hop distance on the non-injured limb in the ACLD group (r = -0.66, p = 0.04).

A Pearson Product Moment Correlation plot illustrating the association between the hop index (injured/non-injured limb hop distance × 100%) and the hop distance on the non-injured limb in the ACLD group (r = -0.66, p = 0.04).