Figure 2.

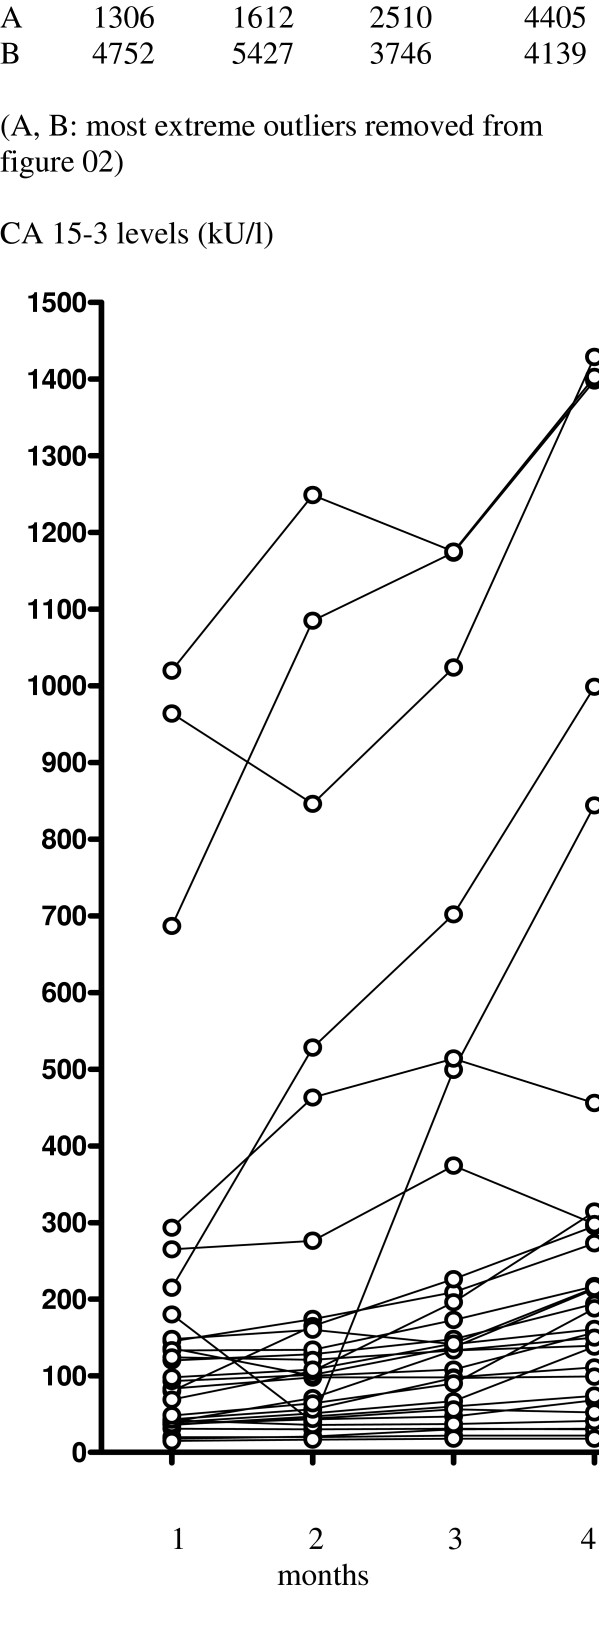
Observed changes in CA 15-3 levels in patients with de novo disease progression from baseline to 4th treatment (n = 32).

Observed changes in CA 15-3 levels in patients with de novo disease progression from baseline to 4th treatment (n = 32).