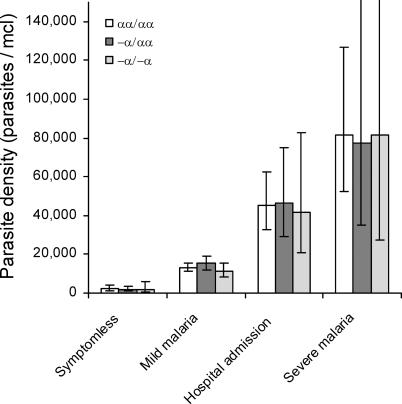
Figure 1. Parasite Densities by Clinical Status and α +-Thalassaemia Genotype .
Geometric mean parasite densities are shown with 95% CIs. Data on symptomless parasitaemia reflect 59 measurements on normal (αα/αα) children, 100 on heterozygotes (−α/αα), and 23 on homozygotes (−α/−α) for α +-thalassaemia. The equivalent figures for mild, hospital, and severe malaria are described in Tables 1 and 2. Between-genotype differences were tested using linear regression both with and without adjustments for age, season, and within-patient clustering. No significant differences were found.

