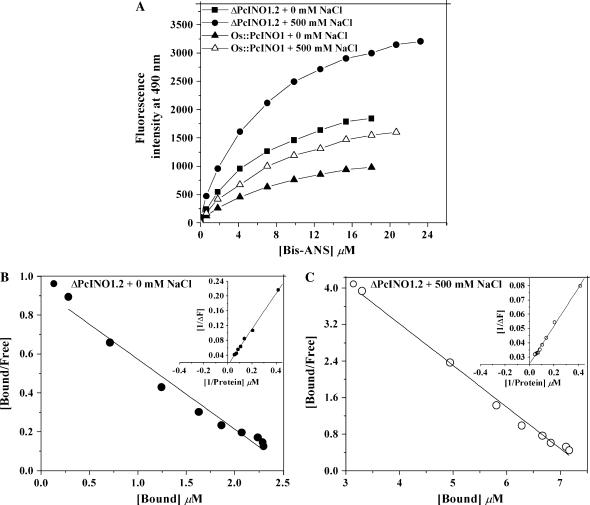
Figure 6.
Surface hydrophobicity of PcINO1 mutant proteins. A, Bis-ANS binding titration of ΔPcINO1.2 and Os∷PcINO1 in presence and absence of added salt. A total of 0.15 mg/mL of each protein, in 20 mm Tris-HCl (pH 7.5), and 10 mm β-ME was titrated in total 1 mL reaction volume by aqueous solution of bis-ANS. The excitation and emission wavelengths were 390 and 490 nm, respectively. The intensities at 490 nm, from the titration, were plotted as a function of bis-ANS concentration. In both the cases of titration in no salt and salt condition, protein was incubated at 37°C either in absence or presence of salt for 10 min before being subjected to titration. Black square, ΔPcINO1.2 + 0 mm NaCl; black circle, ΔPcINO1.2 + 500 mm NaCl; white triangle, Os∷PcINO1 + 0 mm NaCl; and black triangle, Os∷PcINO1 + 500 mm NaCl. B and C, Typical representative Scatchard plot of ΔPcINO1.2 for the determination of stoichiometry (n) and the dissociation constant (kd) in absence (B) and presence (C) of 500 mm NaCl. Respective insets show the double reciprocal plot of reverse titration data as a function of protein concentration for the determination of ΔFmax. In reverse titration also, protein samples were incubated at 37°C, either in absence or presence of salt for 10 min before being subjected to titration under no salt and salt conditions, respectively.

