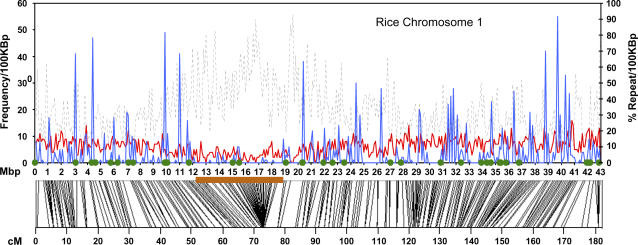
Figure 5.
CISP density correlates with recombogenicity. Rice chromosome 1 is shown. Top section, The left y axis shows the frequency of EST-verified genes (solid red line) and CISPs (solid blue line) per 100-kb interval. The right y axis shows the percent repetitive DNA (dotted black line). Green dots show the location of CISP primer sets tested in this study. The x axis shows the base pair location on the chromosome in Megabases. Bottom section, Rice Genome Project genetic marker locations are shown as lines to their chromosomal position (top x axis). The brown box indicates the estimated heterochromatic region. The bottom x axis shows the centiMorgan location on rice linkage group one.

