Figure 1.
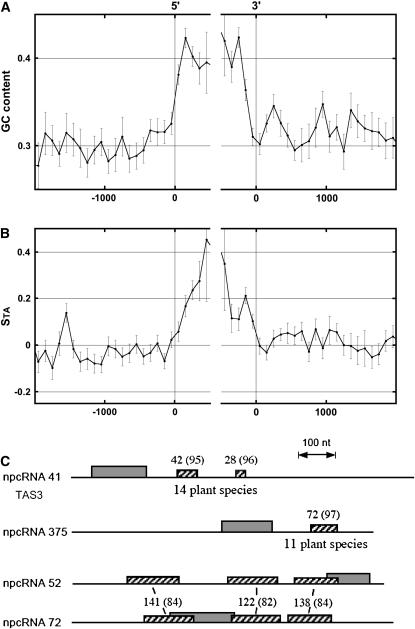
Bioinformatic analysis of compositional biases and nucleotide conservation of npcRNA genes. A, GC content in the regions surrounding the 5′- and 3′-npcRNA gene extremities calculated in adjacent windows starting from each gene extremity in both directions. In the abscissa, the distance (in nucleotides) of each 100-bp window to the indicated gene extremity is presented, zero values of the abscissa corresponding to 5′ (left) or to 3′ (right) gene extremities. In the ordinate, the mean values, for all npcRNAs, of the GC content are calculated at the corresponding abscissa in the corresponding windows; vertical bars indicate se. B, Strand asymmetries STA = (T − A)/(T + A), where A and T are the numbers of the corresponding nucleotides in the sequence window; abscissa is as in A. C, Conserved nucleotide regions in npcRNAs. Regions conserved in ESTs from other species are indicated for npcRNAs 41 (TAS3) and 375. For npcRNA 41 and npcRNA 375, homologies are present in 14 (e.g. Oryza sativa, Populus tremula, Glycine max, and Picea glauca) and 11 (e.g. Oryza sativa, Citrus sinensis, Antirrhinum majus, and Hordeum vulgare) species, respectively. npcRNA 52 and 72 genes are two paralogous candidate genes. Hatched boxes, Conserved nucleotide fragments; gray boxes, longest ORF. Numbers above boxes indicate the size of the matching regions in nucleotides (in Arabidopsis); the percentage of identity is indicated in parentheses.

