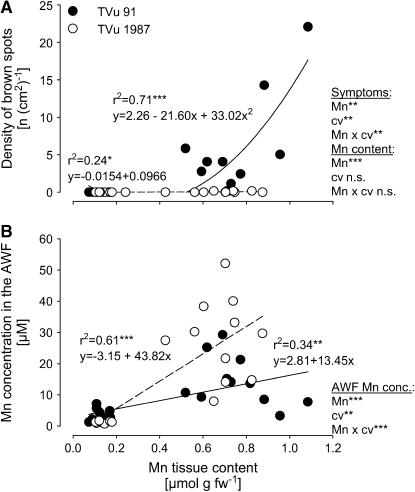
Figure 1.
Relationship between Mn content in the bulk-leaf tissue and the density of brown spots on leaves (A) and the Mn concentration in the AWF (B). Plants of cowpea cv TVu 91 and cv TVu 1987 were treated with 50 μm Mn for 4 d, whereas control plants received 0.2 μm Mn continuously, n = 12. Levels of significance of regression analysis and F test are shown by *, **, and *** for P < 0.05, 0.01, and 0.001, respectively. n.s., Not significant.

