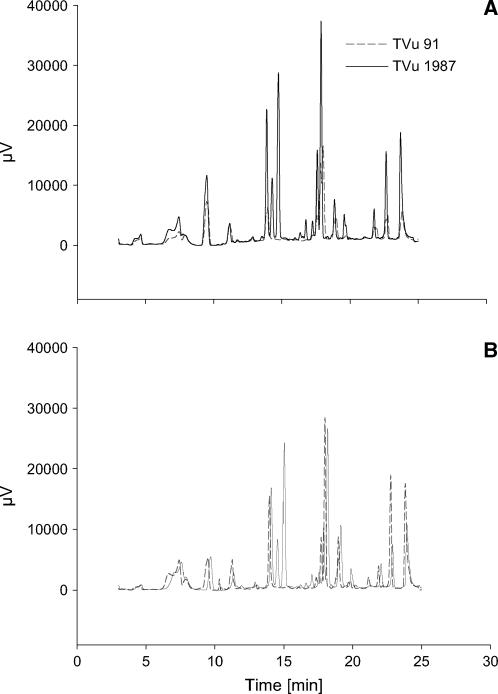
Figure 10.
HPLC chromatograms of phenols in the AWF from the leaves of controls (A) and Mn treatments (B) of cowpea cv TVu 91 and cv TVu 1987. Plants were treated with 50 μm Mn for 4 d, whereas control plants received 0.2 μm Mn continuously. AWF was acidic hydrolyzed at 80°C and phenols extracted by solid-phase extraction. Results show the chromatograms of three biological repetitions and three measurements combined using the Kontron system 3000 software (Kontron Instruments).

