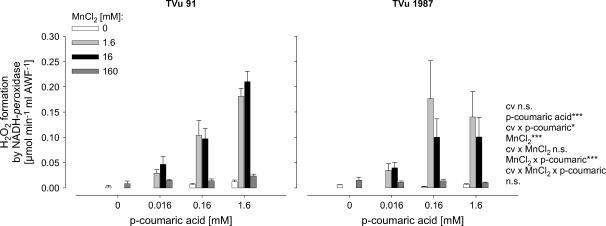
Figure 5.
Effect of MnCl2 and p-coumaric acid concentrations on the in vitro formation rate of H2O2 by AWF proteins from Mn-treated plants (50 μm Mn for 4 d) of cowpea cv TVu 91 and cv TVu 1987. Concentrations of added p-coumaric acid varied from 0 to 1.6 mm, and of MnCl2 from 0 to 160 mm. Values are means of independent replicates ±se, n = 4. Levels of significance of F test are shown by *, **, and *** for P < 0.05, 0.01, and 0.001, respectively. n.s., Not significant.

