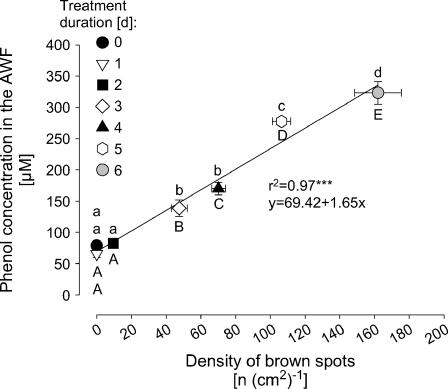
Figure 8.
Relationship between the total phenol concentrations in the leaf AWF and the density of brown spots in cowpea cv TVu 91. Plants were precultured in nutrient solution and Mn concentration was increased to 50 μm for 1, 2, 3, 4, 5, or 6 d, respectively. Control plants received 0.2 μm continuously. Values are means of independent replicates ±se, n = 14. Significant differences between means are indicated by different letters at P < 0.05 (Tukey): uppercase letters for density of brown spots and lowercase letters for phenol concentrations. Levels of significance are shown by *, **, and *** for P < 0.05, 0.01, and 0.001, respectively.

