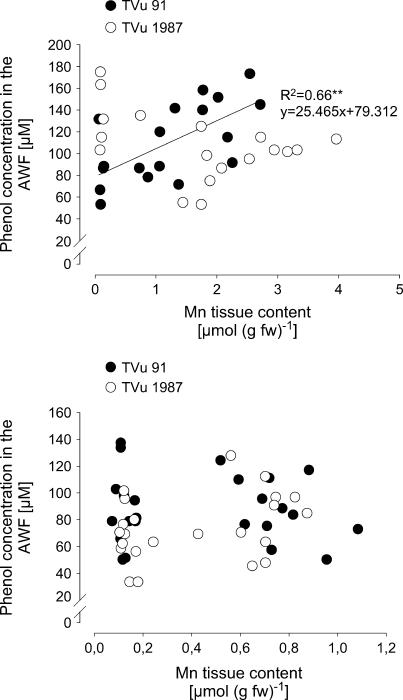
Figure 9.
Relationship between Mn tissue contents and total phenol concentrations in the leaf AWF of cowpea cv TVu 91 and cv TVu 1987. Plants were treated with 50 μm Mn for different treatment periods of 0 to 5 d resulting in a wide (top) or a narrow (bottom) range of Mn leaf-tissue contents and Mn toxicity symptoms only in the Mn-sensitive cv TVu 91 [up to 60 or <20 brown spots (cm)−2, respectively]. Phenol concentrations were determined with the Folin-Denis reagent and calculated using standard solutions of p-coumaric acid in the range from 0 to 300 μm.

