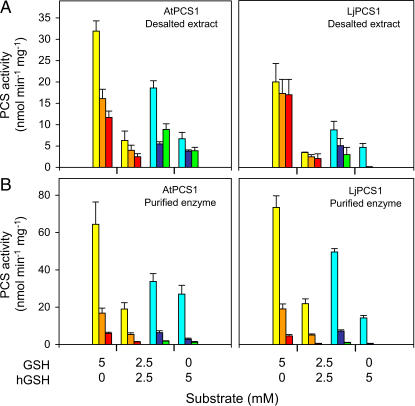
Figure 3.
Substrate specificity of PCS enzymes from model plants. A, Desalted crude extracts of AtPCS1 (200 μg of protein) and LjPCS1 (120 μg of protein) were assayed (30 min) with 500 μm Cd2+ and the stated concentrations of (h)GSH. B, Purified AtPCS1 (60 μg of protein) and LjPCS1 (60 μg of protein) were assayed (30 min) with 50 μm Cd2+ and the stated concentrations of (h)GSH. The polypeptides PC2 (yellow), PC3 (orange), PC4 (red), hPC2 (light blue), hPC3 (dark blue), and hPC4 (green) were quantified by HPLC with postcolumn derivatization. Values are given in nmol of (h)PCs produced (GSH equivalents) per minute per milligram of protein and represent means ± se of four to six enzyme preparations.

