Figure 5.
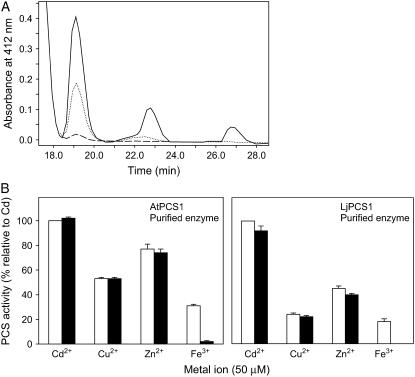
Activation of PCS enzymes from model plants by Fe. A, Representative HPLC chromatogram showing activation of purified AtPCS1 by 5 mm GSH and either 50 μm Cd2+ (solid line) or 50 μm Fe3+ (dotted line). The latter reaction is completely inhibited by 500 μm desferrioxamine (dashed line). Note the synthesis of PC2–4 with Cd2+ and of PC2–3 with Fe3+ after the 30-min incubation period. B, Purified AtPCS1 (60 μg of protein) and LjPCS1 (60 μg of protein) were assayed with 50 μm metal ion, 5 mm GSH, and either 0 (white bars) or 500 μm (black bars) of desferrioxamine. AtPCS1 was incubated for 30 min and LjPCS1 for 60 min. All reactions were completely inhibited by 500 μm EDTA. Values are means ± se of two to three enzyme preparations and are expressed in percent relative to the PCS activities with Cd2+. The 100% values correspond to specific activities of 91 ± 4 (AtPCS1) and 68 ± 4 (LjPCS1) nmol of total PCs (GSH equivalents) produced per minute per milligram of protein.

