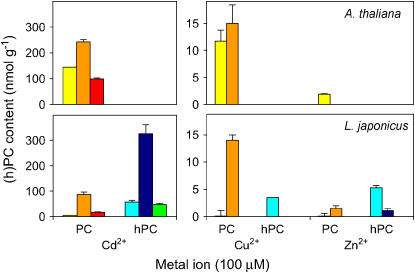
Figure 6.
Synthesis of PCs and hPCs in model plants in response to metals. Arabidopsis and Lotus plants were treated for 4 d with 100 μm Cd2+, 100 μm Cu2+, 100 μm Zn2+, or 500 μm Fe3+. Figure shows (h)PC contents in whole plants of Arabidopsis and in roots of Lotus. Control (untreated) and Fe3+-treated plants had no detectable (h)PCs. Color codes for the (h)PC polypeptides are as in Figure 3. Values are means ± se of three to four plants and are expressed in nanomoles of (h)PCs (GSH equivalents) per gram of fresh weight.

