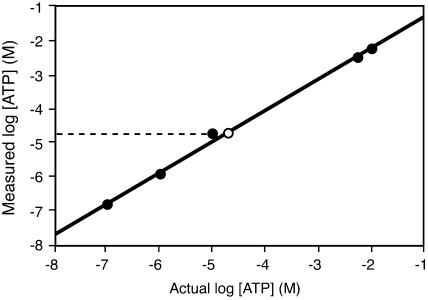
Figure 2.
Measurement of [ATP] at Arabidopsis wound sites. The average of the calculated concentrations of the known samples (black circles) are plotted against the known concentration of the samples (n ≤ 3). The regression equation of the measured versus actual concentrations (y = [0.9150 × x] − 0.3875; r2 = 0.997) was used to correct the average measured ATP concentration (white circle) at Arabidopsis wound sites (n = 7). ATP concentrations are shown as log molar values. The sd (not shown) for the 40 μm mean value recorded was ± 22 μm.

