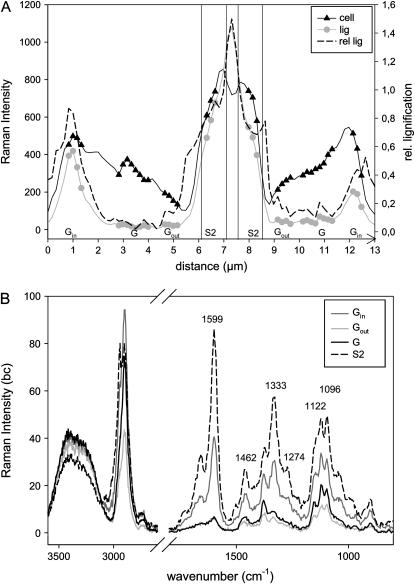
Figure 4.
A and B, Intensity distribution of lignin (1,550–1,650 cm−1), cellulose (cell: 1,026–1,195 cm−1), and relative lignification (ratio of lignin to cellulose intensity) across the cell wall (line marked in Fig. 3A) of poplar G-fibers (A) and the corresponding bc spectra from the marked positions within the G (G, Gin, and Gout) and S2 layers (B).

