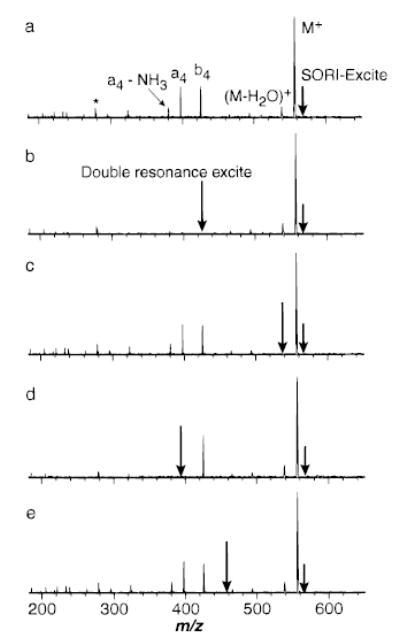
Figure 2.

(a) SORI–CAD spectrum of protonated leucine enkephalin with the excitation frequency applied for 10 ms, 500 Hz below the ions cyclotron frequency (2.5 Vpp). Spectra collected under the same conditions as (a) but with an addition excitation (10Vpp) to continuously remove (b) the b4 ion, (c) (M + H − H2O)+, (d) the a4 ion, and (e) m/z 450 (b–e are double resonance experiments). * indicates a harmonic of the precursor ion.
