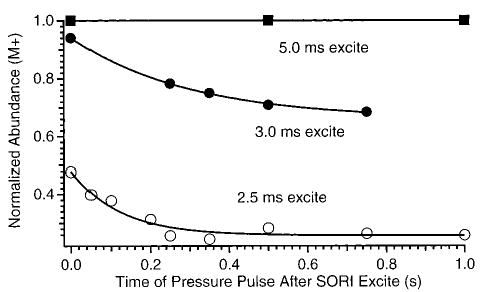
Figure 3.

SORI–CAD dissociation data (ΔΩ = 200 Hz, Vpp = 850 mV) as a function of the time that the nitrogen gas pulse is extended after the irradiation of the ions. The three irradiation times leave the ions at their maximum radius (5.0 mm, 2.5 ms), an intermediate radius (4.4 mm, 3.0 ms), and minimum (unexcited) (5.0 ms) radius.
