
Figure 4.
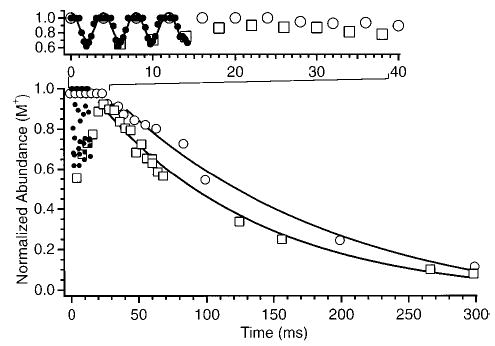
Normalized precursor ion abundance of protonated leucine enkephalin as a function of SORI excitation time. The open squares and open circles represent data points sampled at times in which the excitation wave form is stopped exactly when the irradiated ions have a maximum and minimum cyclotron radius, respectively.