
Fig. 3.
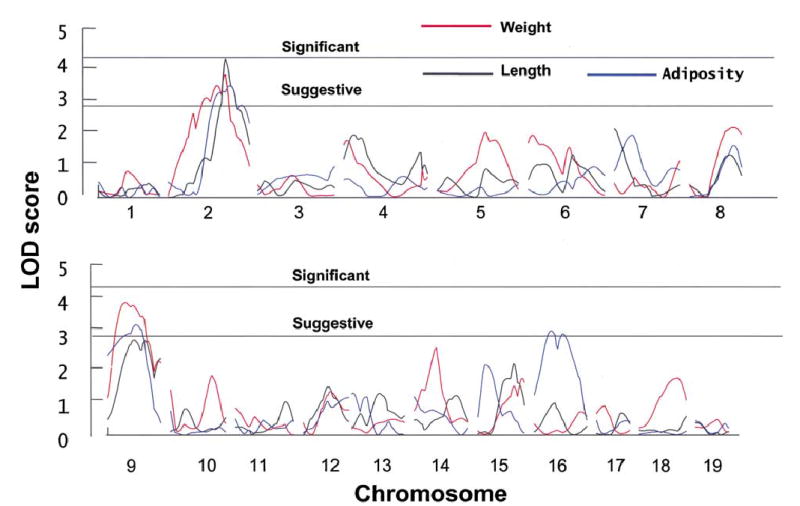
LOD scores (unconstrained model) from a genome scan with adjusted body weight, body length, and adiposity as phenotypes (N = 169). The lower line reflects the threshold for suggestive (LOD ≥ 2.8) linkage, and the upper line reflects the threshold for significant linkage (LOD ≥ 4.3) for an unconstrained model.