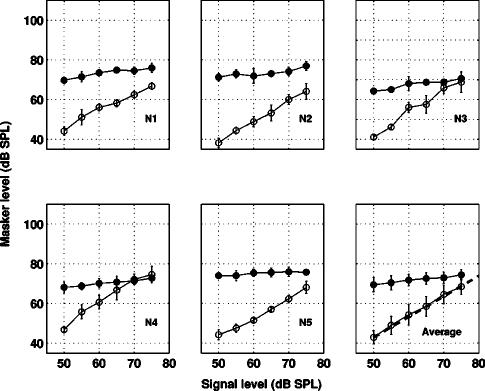
FIG. 4.
GOM functions measured at a signal frequency of 6 kHz for normal-hearing listeners in experiment IA. Each panel represents a different subject or the mean data. Filled symbols represent off-frequency masked thresholds and open symbols represent on-frequency masked thresholds. Error bars represent ±1 standard deviation. The dotted line plotted in the bottom panel titled “Average” represents a straight line with a slope of one.

