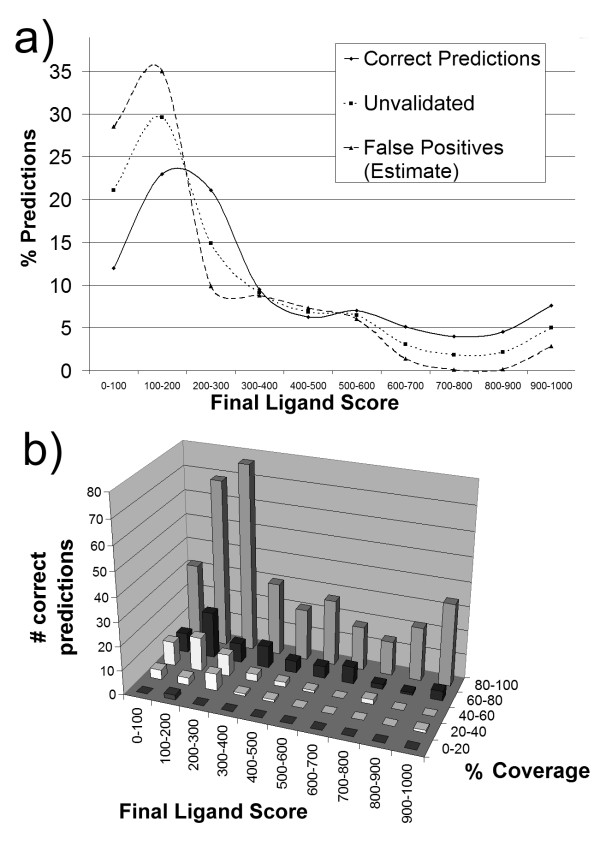
Figure 5.

SMID-BLAST validation final ligand score distributions. a) Distribution of predictions in the validation set as a function of final ligand score. The solid line represents percent correct predictions, while dotted line represents predictions that were not observed in the PDB validation set; these latter interactions are comprised of both false positives, and true positives that simply have not been observed yet. For example, 12% of correct predictions had a final ligand score below 100, while 21% of unvalidated predictions had a final ligand score below 100. The dashed line represents an estimate of the distribution of final ligand scores for false positives as outlined in the text. b) Coverage as a function of final ligand score, for the predictions which were observed in the PDB validation set. Coverage is defined as the percent of true binding site residues which were included in the predicted binding site.
