
Figure 2.
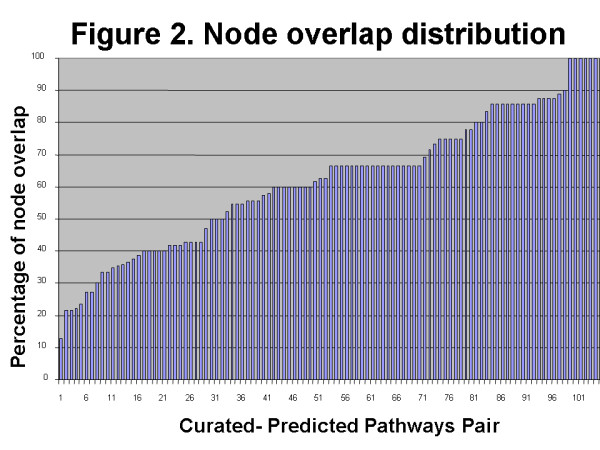
Distribution of node overlaps between manually curated pathway and equivalent regulome pathway with the same ligand-receptor pair. X axis – every point represents a pair of manually curated and automatically built pathways, Y axis – number of nodes in common between two pathways.