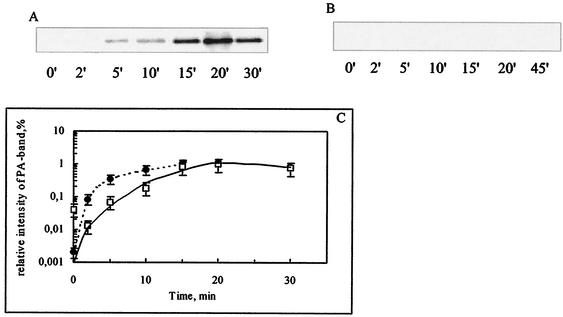
FIG. 3.
Translocation kinetics for ppPA and OmpT-PA. (A and B) E. coli K5 carrying plasmid pPAEC or pPAOT was grown at 28°C in the chase medium. At 10 min after induction, the cells were pulse-labeled with [35S]methionine for 1 min and then chased with nonradioactive methionine. At the times indicated, samples (500 μl) were withdrawn, subjected to immunoaffinity chromatography for the quantitative isolation of mature PA, and assessed by SDS-PAGE followed by autoradiography. The position of the B-chain PA band was verified by using a prestained protein marker (Bench Mark; Gibco BRL). (A) ppPA. (B) OmpT-PA. (C) The intensity of the B chain of PA from panel A (squares) and panel B (circles) was quantified by using ONE-Dscan and is represented graphically as a function of the chase time. The highest intensity reached in each blot was taken as 1. Error bars indicate standard deviations.

