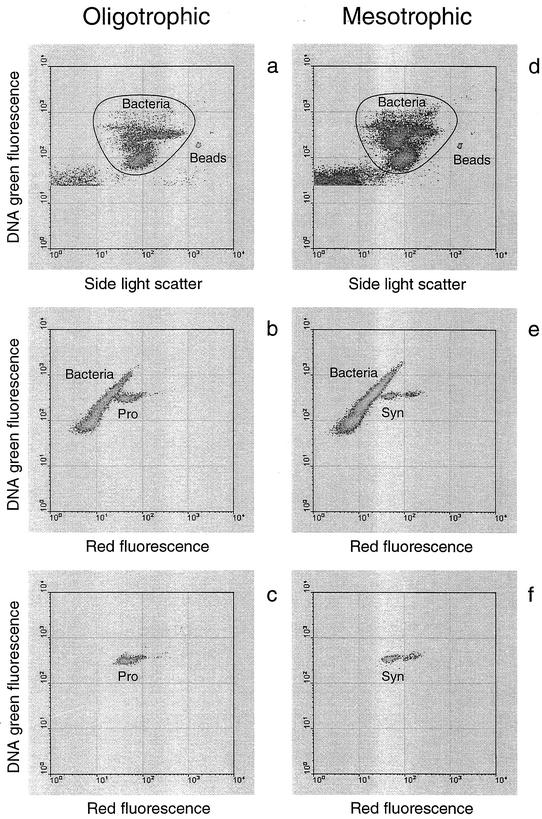
FIG. 2.
Characteristic flow cytometric signatures of natural bacterioplankton in oligotrophic (a to c) and mesotrophic (d to f) regions of the Arabian Sea. Clearly revealed bacterioplankton cells stained for DNA were gated by the polygons (a and d) for radiolabel sorting to determine [35S]methionine uptake by an average bacterioplankton cell. The bacterial cells within the polygons were plotted separately to show Prochlorococcus (Pro) (b) and Synechococcus (Syn) (e) clusters with extra red fluorescence. The clusters of Prochlorococcus (c) and Synechococcus (f) sorted for radiolabel analyses were plotted separately.

