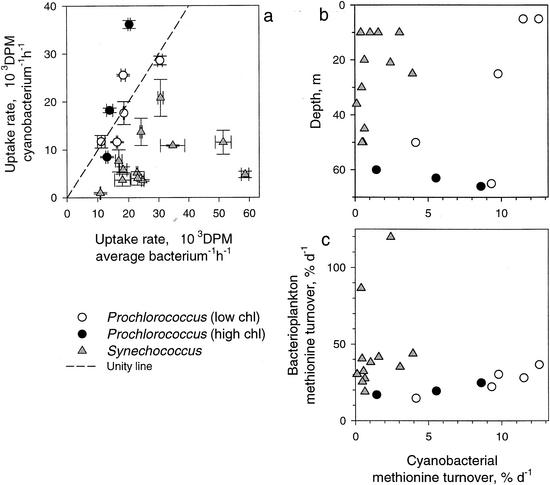
FIG. 3.
Comparison of [35S]methionine uptake rates of flow-sorted Prochlorococcus and Synechococcus cells with uptake rates of average bacterioplankton cells (a) as well as vertical distributions of cyanobacterial methionine turnover (b) and its comparison with total bacterioplankton turnover (c). The uptake rates of average bacterioplankton cells were determined by flow sorting of the whole bacterioplankton community. Error bars indicate a single standard error of three measurements. Dashed line indicates a unity line. d, days. Data derived from Prochlorococcus sorted from the partially resolved clusters are shown by open circles and from the complete clusters by filled circles. DPM, disintegrations per minute.

