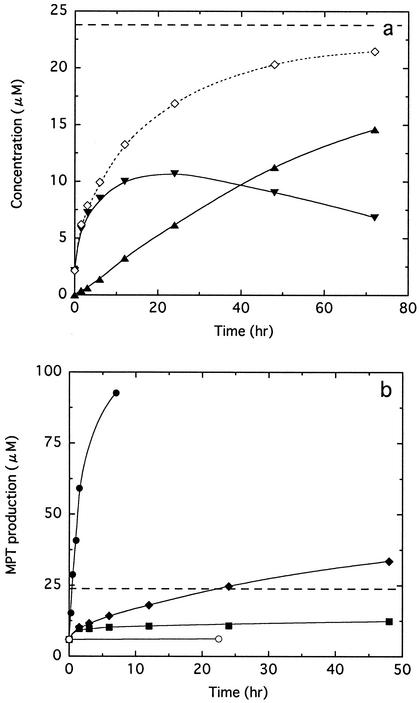
FIG. 3.
Time course of F-I activity for TPT (a) and DPT (b). These reactions were performed at 40°C in a mixture containing 23.8 μM F-I and 200 μM TPT or DPT. The concentration of F-I used is drawn as an additional dashed line. (a) Concentrations of DPT (▾) and monophenyltin (▴) produced were determined using postcolumn HPLC. The total amounts (⋄) of the products during the reaction were calculated from the amounts of DPT and monophenyltin produced. (b) Concentrations of monophenyltin produced in reaction mixtures containing 100 μM CuCl2 (•), FeCl3 (▪), and no metal ion (♦) were determined. The control (○) contained CuCl2 and DPT in the reaction mixture, except for F-I.

