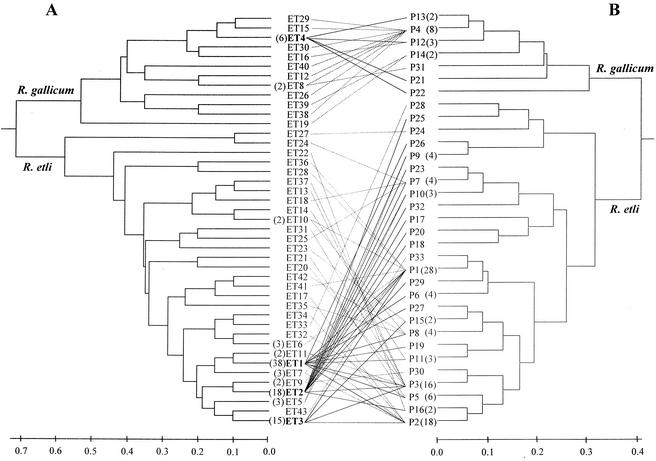
FIG. 1.
Dendrograms showing the genetic relatedness among chromosomal and plasmidic genotypes of R. etli and R. gallicum and the chromosome-plasmid profile combinations. (A) Genetic relatedness of the multilocus genotypes based on 10 isoenzymatic loci. The ET designations are indicated. (B) Genetic relatedness of the plasmid profiles based on the presence or absence of the different plasmid size classes. The plasmid profile designations are indicated. The number of isolates for each multiple ET or plasmid profile is given in parentheses. The genetic distance between each pair of ETs or plasmid profiles was estimated by determining mean character differences, and data were clustered by the UPGMA. The four most abundant ETs and their plasmid profile combinations are indicated by boldface type and solid lines; the other combinations are indicated by dashed lines.

