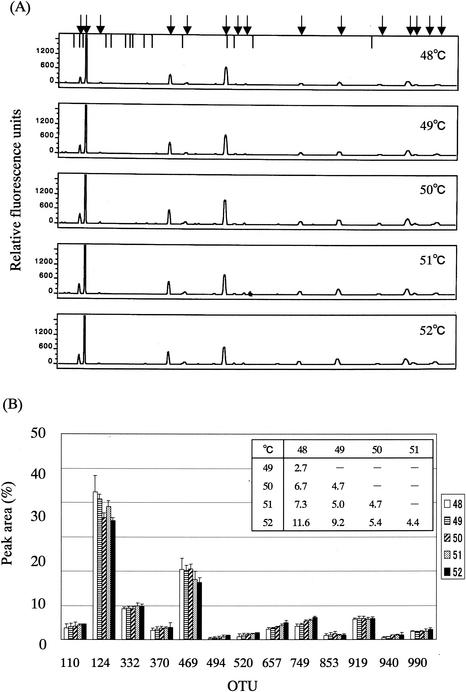
FIG. 2.
Effect of annealing temperature in PCR on T-RFLP profile. (A) Electropherograms of the T-RFs produced by BslI digestion of 16S rRNA gene amplicons from PCR at the indicated annealing temperatures. Fecal DNA from individual G was used as the PCR template. Arrows indicate the positions of OTUs: 110, 124, 160, 332, 370, 469, 494, 520, 657, 749, 853, 919, 940, 995, and 990 bp from the left side. Vertical bars indicate the positions of size markers: 94, 109, 116, 172, 186, 222, 233, 238, 269, 286, 361, 470, 490, 516, and 827 bp from the left side. (B) Comparison of relative abundances of OTUs among the electropherograms. Data are expressed as means + standard deviations from three independent experiments with the same DNA preparation. The numbers in the key indicate the annealing temperature (°C). D values are presented in the inset table.

