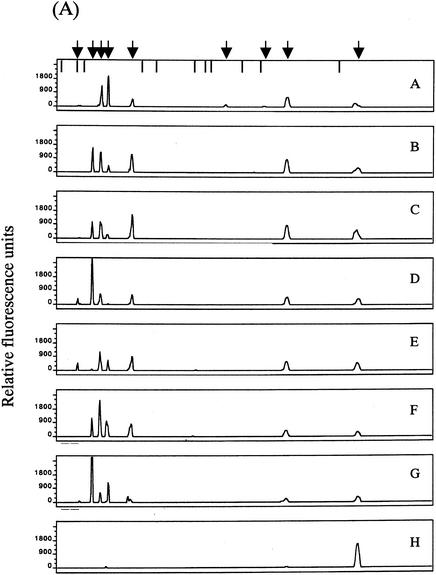
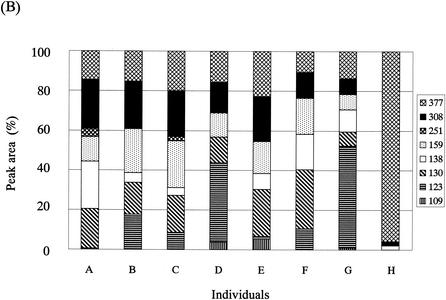
FIG. 5.
T-RFLP profiling of fecal samples from different individuals with RsaI-plus-BfaI digestion. (A) Electropherograms of the T-RFs produced by RsaI-plus-BfaI digestion of 16S rRNA gene amplicons from fecal DNAs of eight individuals (individual A, 48-year-old male; individual B, 49-year-οld female; individual C, 38-year-old male; individual D, 38-year-old male; individual E, 2-year-old female; individual F, 37-year-old male; individual G, 2-month-old female; individual H, 2-week-old female). Arrows and bars are as described for Fig. 4. (B) Relative abundances of OTUs in each electropherogram. Peak area is expressed as an average from experiments with two different DNA preparations from the same fecal sample. The numbers in the key indicate OTUs.


