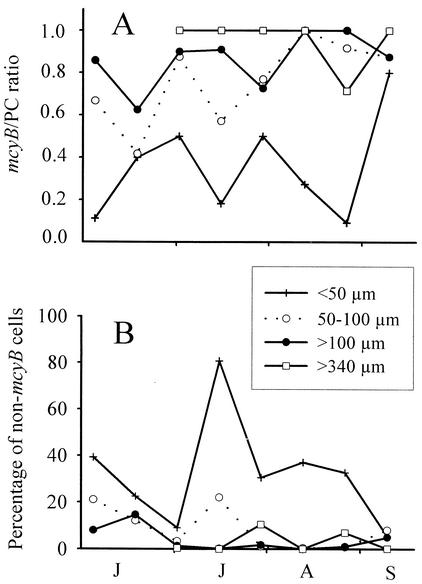
FIG. 5.
Proportions of microcystin-producing genotypes in different colony size classes. (A) Ratio of the microcystin (mcyB) gene to the PC gene for each colony size class of Microcystis during the summer of 2000. The ratio of mcyB products to PC products is expected to be ∼1 if a sample consists solely of microcystin-producing genotypes and to decrease to 0.4 if the microcystin-producing genotypes constitute 10% only (see also Fig. 2). (B) Percentage of non-microcystin-producing cells found, as inferred from a PCR analysis of dilution series for each colony size class. Months from June to September are indicated from left to right.

