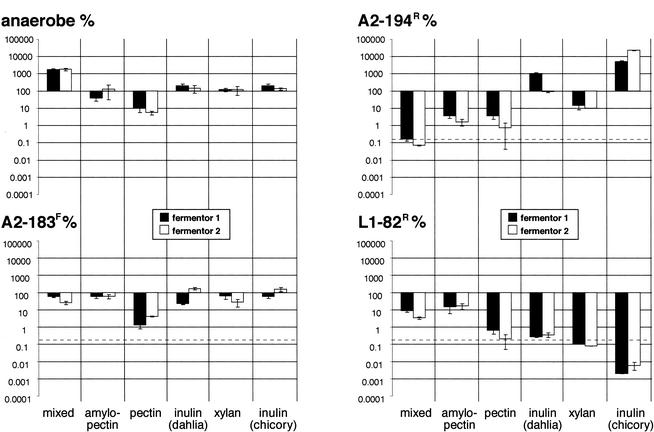
FIG. 3.
Data shown in Fig. 1 replotted to show (on the y axis) the percentage of each strain remaining after 7 days of incubation in the fermentor system relative to the starting inoculum with each specific substrate. The results obtained for the two duplicate fermentors are shown separately. The error bars indicate the deviations from the means of triplicate counts in each fermentor system. The proportion of cells projected to remain after washout is indicated by the dotted line.

