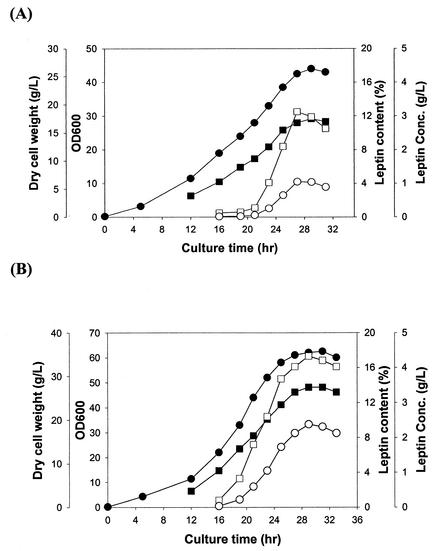
FIG. 1.
Time profiles of cell density (OD600 [•]), DCW (grams per liter [▪]), leptin concentration (grams per liter [○]), and leptin content in total protein (percent [□]) during the growth of fed-batch cultures of E. coli TG1 harboring pTrpAObT (A) and E. coli TG1 harboring pTrpAObT and pACfAZ2 (B).

