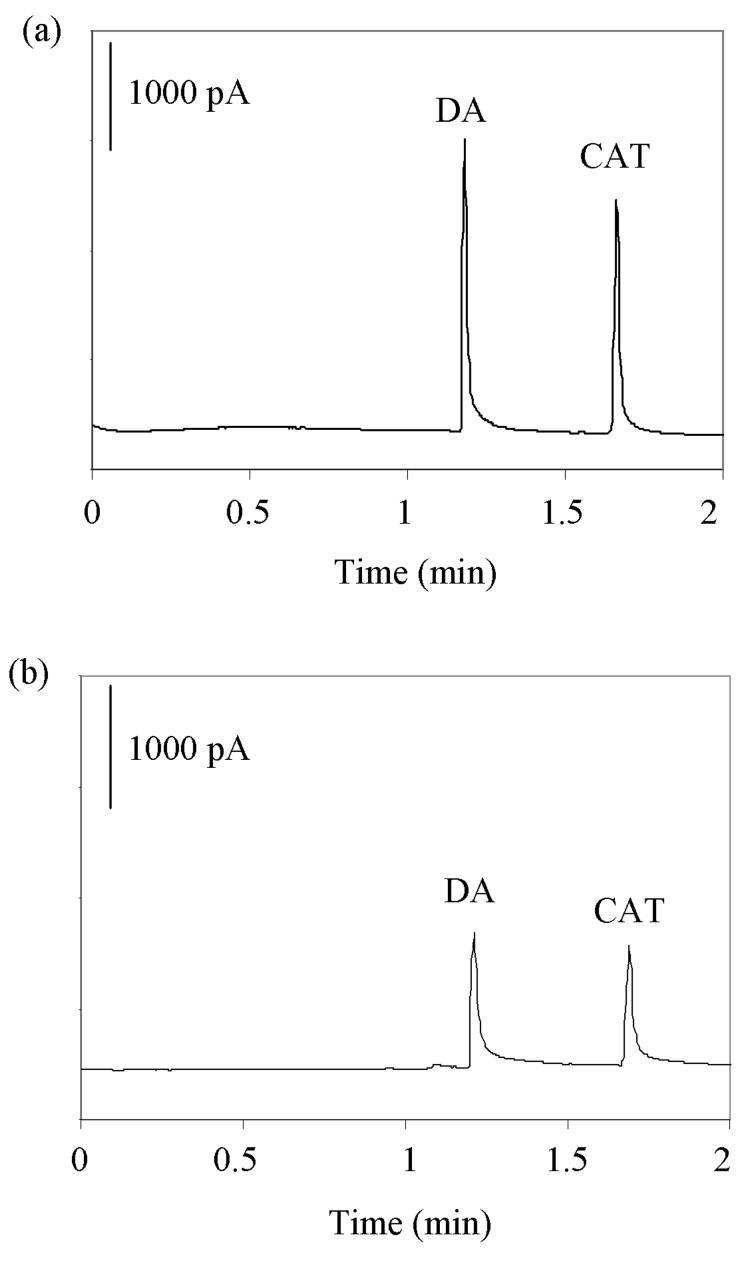
Figure 2.
Comparison of the electropherograms obtained using a 50 μM solution of DA and CAT, a 5-s injection at 5 kV, a 25-kV separation potential and a 10 mM TES (pH = 7.2) separation buffer with 5 % 1-propanol in a 16 μm i.d. capillary with (a) an etched and (b) a standard end-column amperometric detector.

