
Figure 1.
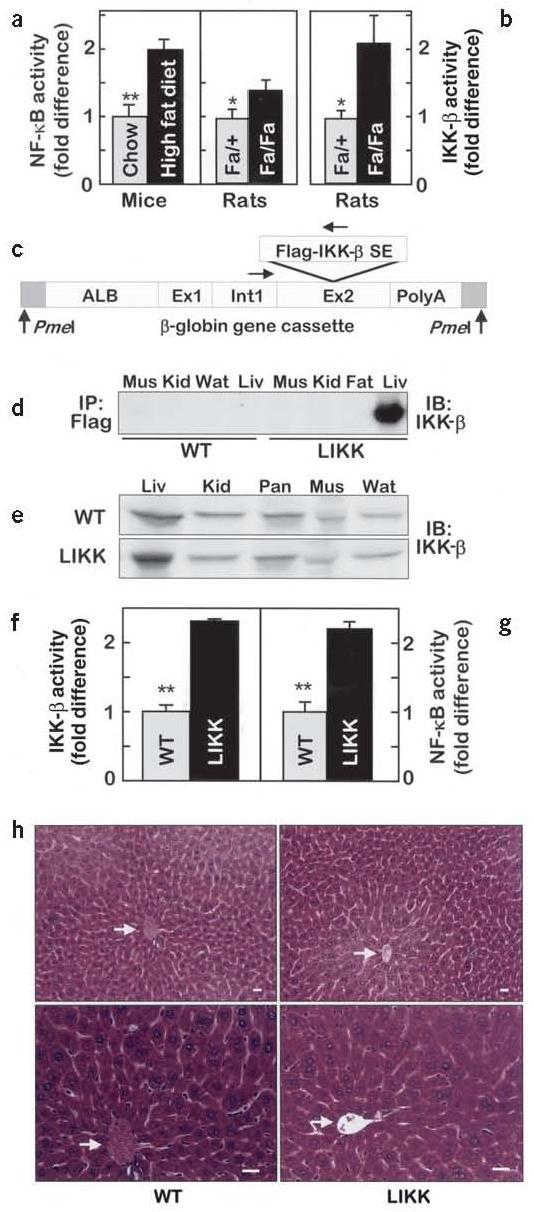
IKK-β and NF-κB activities in liver. (a) NF-κB and (b) IKK-β activities are expressed as fold differences (n = 6, *P < 0.05; **P < 0.01). (c) Schematic map of the transgene construct showing Flag-tagged IKK-β S177E,S181E subcloned into exon 2 of the Alb1 promoter-driven truncated β-globin gene vector. (d) Transgene expression and (e) total amounts of IKK-β in skeletal muscle (Mus), kidney (Kid), white adipose tissue (Wat), liver (Liv) and pancreas (Pan). (f) IKK-β and (g) NF-κB activities in liver (n = 4–6, **P < 0.01). (h) Hematoxylin and eosin–stained sections of liver. Arrows indicate central veins. Scale bars, 50 μm.