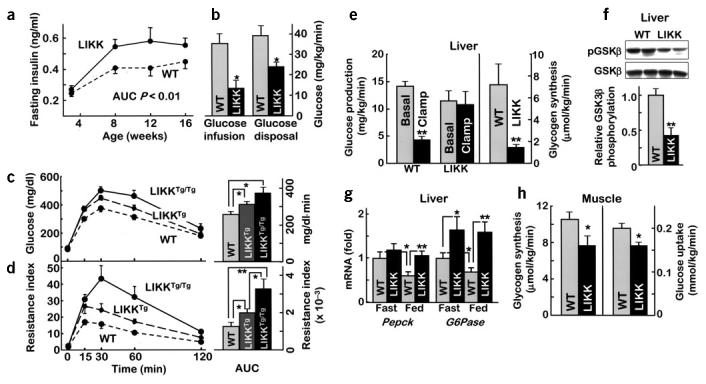
Figure 2.
Carbohydrate metabolism. (a) Fasting insulin levels (n = 8–12; AUC, area under curve). (b) Hyperinsulinemic-euglycemic clamps were performed in 12–15-week-old male mice (n = 10, *P < 0.05). (c,d) Glucose tolerance tests were performed in 12-week-old male mice (n = 6). (c) Glucose concentrations or (d) insulin resistance index (IRI = glucose concentration (mmol/L) × insulin concentration (mU/L) ÷ 22.5) were plotted versus time (left) and as AUC (right, per 120 min). *P < 0.05, **P < 0.01. (e) Hepatic glucose production and glycogen synthesis determined during hyperinsulinemic-euglycemic clamps (n = 10; **P < 0.01). (f) GSK3β phosphorylation in liver after hyperinsulinemic-euglycemic clamps. (g) mRNA expression levels for gluconeogenic enzymes determined using real-time RT-PCR (*P < 0.05, **P < 0.01). (h) Glycogen synthesis and glucose uptake in skeletal muscle during hyperinsulinemic-euglycemic clamps (n = 10, *P < 0.05).

