
Figure 4.
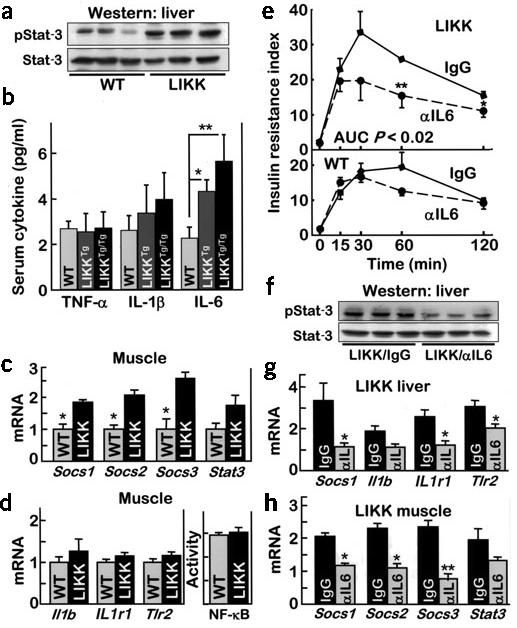
Cytokine signaling in LIKK mice. (a) Western blots of phosphorylated Stat-3 or Stat-3 in liver. (b) Circulating levels of TNF-α, IL-1β and IL-6 (n = 4–8; *P < 0.05, ** P < 0.01). (c,d) mRNA levels in skeletal muscle determined by real-time RT-PCR. NF-κB activity measured by specific DNA binding (n = 6; * P < 0.05). (e) Glucose tolerance tests 2–3 weeks after treatment with neutralizing antibody to IL-6 (αIL6) or control IgG (n = 6; insulin resistance index, IRI = glucose concentration (mmol/L) × insulin concentration (mU/L) ÷ 22.5). (f) Phosphorylated Stat-3 and Stat-3 in livers from mice treated with antibodies to IL-6 (αIL6) or control IgG. mRNA levels in liver (g) and gastrocnemius muscle (h) determined by real-time RT-PCR (*P < 0.05, ** P < 0.01). Il1b encodes IL-1β; Il1R1 encodes IL-1R1.