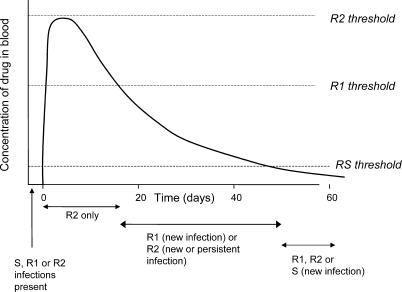
Figure 1. Pharmacokinetics of Drug Resistance.
Concentration of drug in the bloodstream declines over time and falls below threshold levels permissive for growth of parasites with varying degrees of resistance. Dashed lines represent permissive thresholds for RS, R1, and R2 parasites. Adapted from Hastings et al. [ 11]. RS, drug-sensitive parasites; R1, partially resistant parasites; R2, fully resistant parasites.

