
Figure 5.
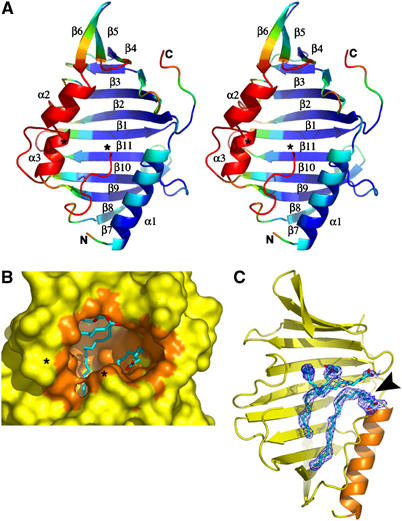
Overall view and cavity content of LppX. (A) Stereo view of the ribbon diagram of LppX with β-strands (β1–11) and α-helices (α1–3) colored as a rainbow gradient according to B-factor values (blue to red corresponds to B-factor values ranging from <30 to >55 Å2) viewed down the cavity entrance. (B) Molecular surface of LppX, oriented as in (A), surrounding the cavity (orange) partially occupied by three long-chain (C18–C22) fatty acids (blue carbon atoms with carboxylate in red). The invisible region (Leu115–Ala119) is symbolized by asterisks. (C) Sigma A-weighted difference electron density maps (contoured at 2.5σ, cyan) showing the location of the three fatty acids, C18:1 (top) and C22 (bottom), within the cavity. The maps were generated using an LppX model from the initial refinement stage devoid of fatty acids and solvent molecules. An arrow indicates the cavity entrance. For clarity, the α-helices α2 and α3 have been omitted.