
Figure 1.
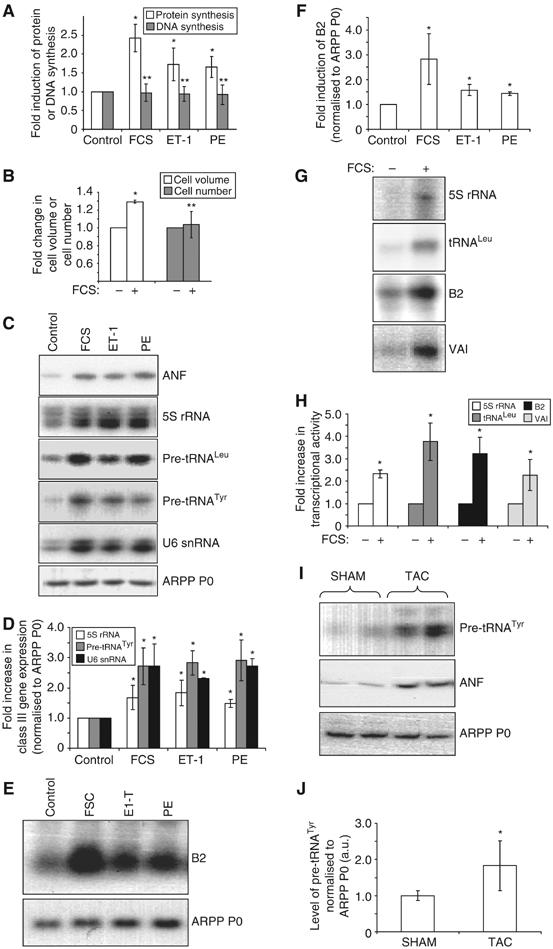
Hypertrophic stimuli activate pol III transcription. (A–F) Cultured cardiomyocytes were serum-starved for 24 h, then either maintained in serum-free media (control) or exposed to 10% FCS, 100 nM ET-1 or 100 μM PE for 16 h, as indicated. (A) Protein and DNA synthesis rates were determined by measuring incorporation of [35S]methionine/cysteine or [3H]thymidine, respectively. The data represent the mean of five separate experiments, each with three replicates per condition. (B) Myocyte volume and number were assayed using a Z2 Coulter counter. The fold increases represent the mean of three separate experiments, each with two replicates per condition. (C) Specific primers for the transcripts indicated were used to PCR amplify cDNAs generated from total RNA of cultured cardiomyocytes treated as specified. (D) RT–PCR transcript intensities were quantified and the level of class III transcripts normalised to ARPP P0. The average fold increases are represented. (E) Northern analysis was performed using total RNA from cardiomyocytes treated as indicated. Northern blots were probed for B2, then stripped and re-probed for ARPP P0. (F) B2 and ARPP P0 RNA levels were quantified by densitometry, and B2 normalised to ARPP P0. The average fold increases are represented. (G) Whole-cell extracts (20 μg), prepared from serum-starved or FCS-stimulated cardiomyocytes, were tested for their ability to transcribe 5S rRNA, tRNALeu, B2 and VAI templates in vitro. (H) Average fold increases in transcriptional activity are displayed graphically. (I) Activation of pol III transcription accompanies hypertrophic growth in situ. RNA was extracted from hearts derived from mice subjected to TAC or sham operation. RT–PCR was performed using pre-tRNATyr-, ANF- and ARPP P0-specific primers. RT–PCRs using RNA derived from two separate animals per condition are shown. (J) Six hearts were analysed as in (I) for each condition, and densitometry used to quantify transcript levels. The average level of pre-tRNATyr, normalised to ARPP P0, is shown. For all bar charts, error bars indicate the standard deviation from the mean (*significantly higher than control, P<0.05; **no significant difference from control).