
Figure 4.
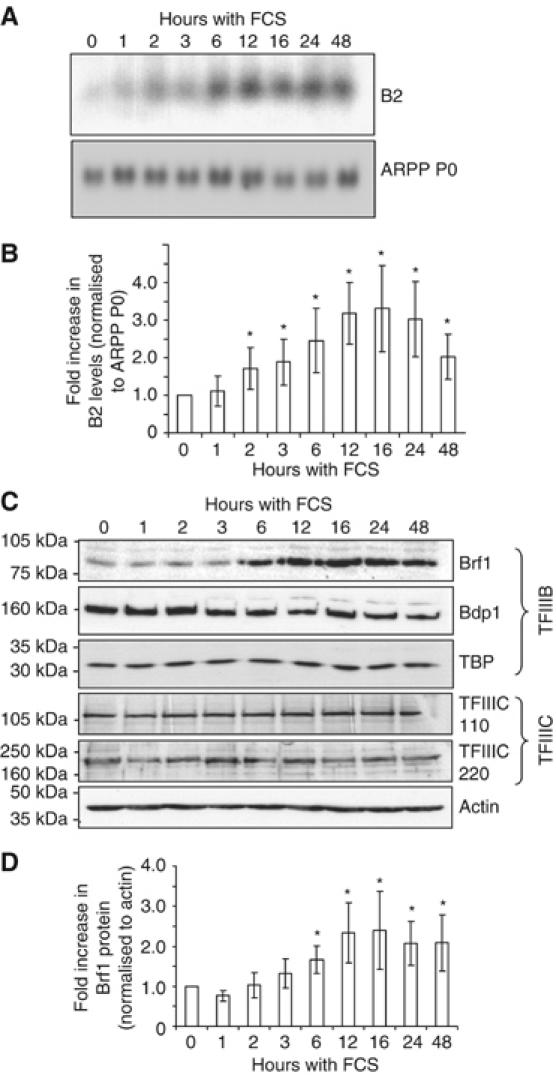
Pol III transcripts increase within 2 h of hypertrophic stimulation, followed by Brf1 induction within 6 h. Serum-starved cardiomyocytes were stimulated with 10% FCS for the times indicated (0–48 h). Whole-cell protein or RNA was then extracted. (A) B2 and ARPP P0 RNA levels were analysed by Northern blotting, and (B) quantified by densitometry (n=4; *significantly different from control, P<0.05). (C) Protein lysates were resolved by SDS–PAGE and Western blotting performed using antibodies against the indicated proteins. (D) The level of Brf1 at each time point was quantified and normalised to actin (n=4; *significantly different from control, P<0.05).