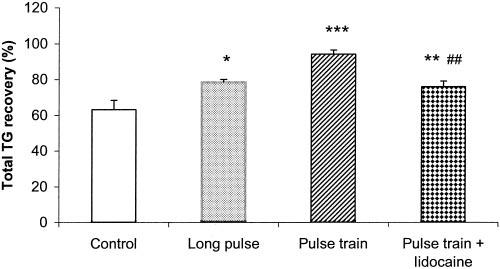
Figure 3.

Effects of IES on the fat absorption. Fat absorption is represented by the percentage of TG recovery at 45 minutes. Values are the mean ± SE. *, p < 0.05; **, p < 0.01; ***, p < 0.001 (vs. the control group, n = 10). ##, p < 0.01 (vs. the trains of short pulses group, n = 10).
