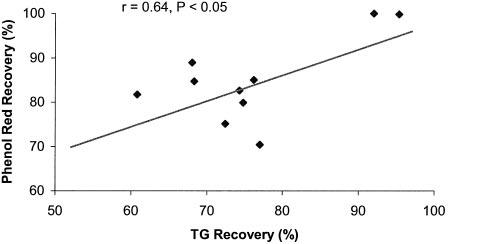
Figure 5.

Relationship between fat absorption and jejunal transit in the group of IES with lidocaine. Fat absorption is represented by the percentage of TG recovery at 45 minutes. Intestinal transit is represented by the percentage of recovered phenol red at 45 minutes (n = 10). Plotted values are mean of the percentage of TG recovery and the percentage of recovered phenol red. r = 0.64, p < 0.05.
