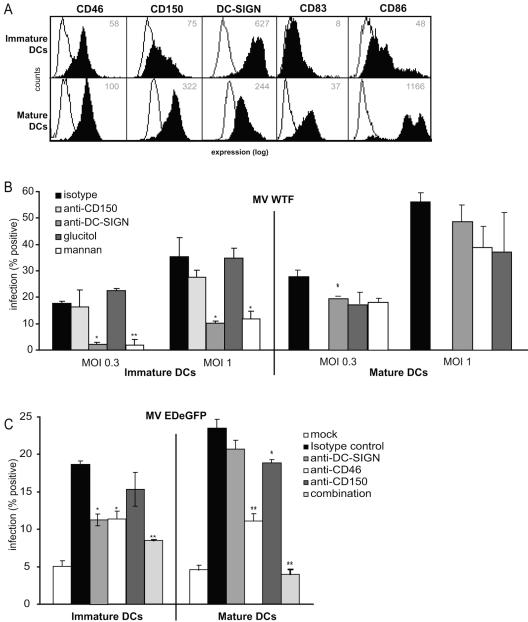
FIG. 7.
DC-SIGN enhances MV infection of immature DCs. (A) High expression levels of maturation markers CD83 and CD86 on mature DCs indicate a mature phenotype. The expression of the different MV receptors was measured. Open histograms represent isotype controls, and filled histograms indicate specific antibody staining. The mean fluorescence intensity of specific staining is depicted. Expression is shown in log scale and ranges from 100 to 104. (B) Immature and mature DCs were infected with MV WTF (MOI, 0.3 and 1) or a mock control for 48 h. To determine the contribution of DC-SIGN, a specific antibody (AZN-D2) or mannan was used. An antibody (L7) or carbohydrate control (glucitol) was used as a control. With immature DCs, the role of CD150 could be determined by using a specific blocking antibody (5C6). To determine the level of infection, MV H expression was measured by flow cytometry. Percentages represent the numbers of infected cells. (C) Immature and mature DCs were infected with MV EDeGFP (MOI, 0.25) or a mock control for 48 h. Infection was determined by measuring GFP using flow cytometry. The MV receptors DC-SIGN, CD46, and CD150 were specifically blocked by antibodies (AZN-D2, 13/42, and 5C6, respectively) or a combination of the three antibodies to determine their roles in MV infection. Data for one representative experiment of three are shown. Error bars represent standard deviations of triplicates. *, P < 0.05; **, P < 0.01 (versus controls).

