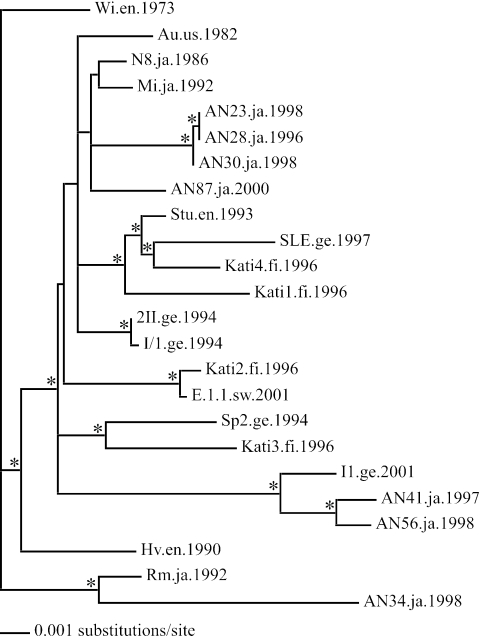
FIG. 3.
Phylogeny of 24 B19 virus coding regions used in the substitution rate analyses. The tree is rooted with the oldest isolate. Branch lengths are drawn to scale, and nodes with >70% bootstrap support are marked with an asterisk. Names of sequences are given along with the location and date of isolation. Abbreviations are as described in the legend for Fig. 2.

