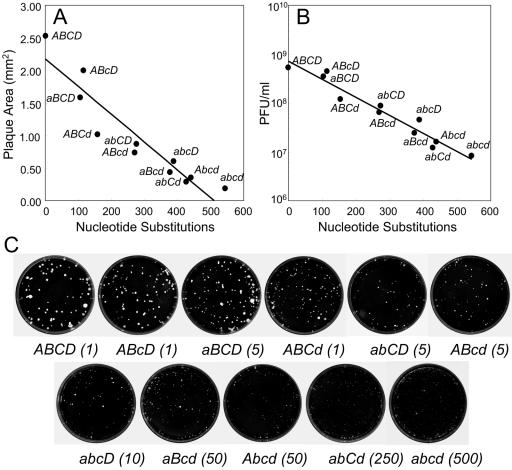
FIG. 3.
(A) Mean plaque areas on HeLa cells versus numbers of nucleotide substitutions in the capsid region. Mean plaque areas were determined for plaques on HeLa cell monolayers after incubation at 35°C for 60 h. The coefficient of determination (R2) for the regression line was 0.88. (B) Virus yields (at 12 h postinfection) in a single-step growth experiment with HeLa S3 cells versus numbers of nucleotide substitutions in the capsid region. Plaque assays (35°C, 72 h) were performed on HEp-2C cells. Plaque morphologies were similar for HEp-2C and HeLa cell monolayers, but plaque yields were ∼2.5-fold lower on HEp-2C cells. The coefficient of determination (R2) for the regression line was 0.94. (C) Plaque morphologies on HeLa cells (35°C, 60 h). Numbers in parentheses indicate relative amounts of infected cell culture lysates yielding the plaques shown in the dishes.

