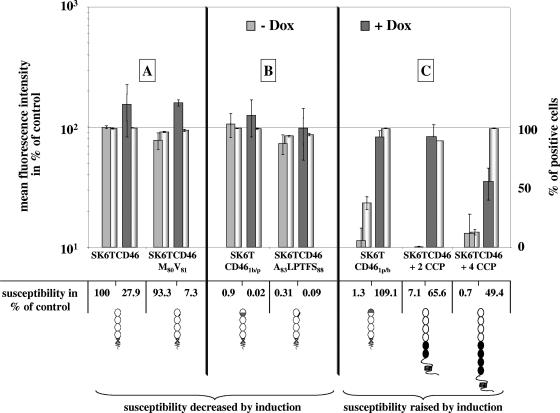
FIG. 9.
Quantification of CD46 surface exposition on selected SK6T cell lines. Seven SK6T cell lines expressing either wt or chimeric CD46 were grown for 24 h in the absence or presence of 5 μg/μl Dox. Trypsinized (2 × 10⁵) cells were subjected to flow cytometric analysis using anti-CD46 MAb BVD/CA 17 and fluorescein isothiocyanate-anti-mouse IgG. Based on their susceptibilities in the absence and presence of Dox cells, cells were grouped into three phenotypes, A, B, and C. Susceptibility as a percentage of that of control cells (SK6T CD46 in the absence of Dox) is indicated beneath the graph. The mean fluorescence intensity of SK6T CD46 cells in the absence of Dox was set to 100%, and CD46 surface exposition was calculated as a percentage of that of the control. The graph includes the mean fluorescence intensity (left y axis) in light gray (− Dox) and dark gray (+ Dox) as well as the percentage of positive cells (right y axis) in white bars. All cell lines and conditions were tested in at least three independent experiments with duplicate determinations.

